
Everyone talks about data: how you need data, where to find it, what to track, everyone is consumed with what the best KPIs are. But then what?
Don’t get me wrong- data is beautiful.
But data is absolutely useless, unless you know what to do with it.
To the untrained eye, a walk through Google Analytics can make your head spin. Even after its recent update, Google Analytics isn’t any easier to understand (unless you happen to be a savvy digital marketer, and even then, it can be hard to make sense of all that).
However, data doesn’t have to be confusing. There are tools out there that make data consumable for your everyday-Joe, and I’ll show you what you can do with your data once you understand it. I’m testing out a data tool called Divvit. What sets it apart is that it’s designed specifically for e-commerce, which can be extremely helpful for those who need it spelled out in layman’s terms.
Why you need to understand your Data
The beautiful part of data is that it takes the mystery out of your business. Once you have data, you know where you need to make improvements and what channels you need to focus on.
For example, let’s say your sales are dropping after you’ve implemented a bunch of new features on your site. With analytics, you get to be a scientist. You get to see exactly where most people are dropping off, and fix the exact things that are wrong with your sales funnel. You could extrapolate that people are bouncing because of something you’ve changed, but with data you could prove it.
This is business after all, you shouldn’t be making optimization decisions based on feeling. You need the data to backup your changes with cold, hard facts.
What’s cool about using tools like Divvit is that you can integrate all of your paid search and marketing campaigns into it to understand the cost it takes to bring a visitor to your site versus how much those visitors actually spend- with marketing ROI data provided for you. You get a snapshot of this directly on the dashboard.

What you can see in just one glance is a breakdown of your traffic, your order count, the overall cost of paid channels, and your order value over the course of a month.
This gives you an immediate breakdown of exactly how your campaigns are running and how much they return for you. You can compare the cost of your campaigns directly against the revenue that you’re bringing in at any given time and compare them over longer periods to see if your paid efforts are paying off.
What to do with this information:
When you know exactly what kind of return your campaigns are giving you, you can decide to add more or pull back budget from these campaigns. Perhaps there are more visits to your site, but no more conversions than before you put them into place.
You’d know that you need to optimize your campaigns so that you’re reaching those who would actually like to purchase from you, as opposed to those who are clicking through for the wrong reasons.
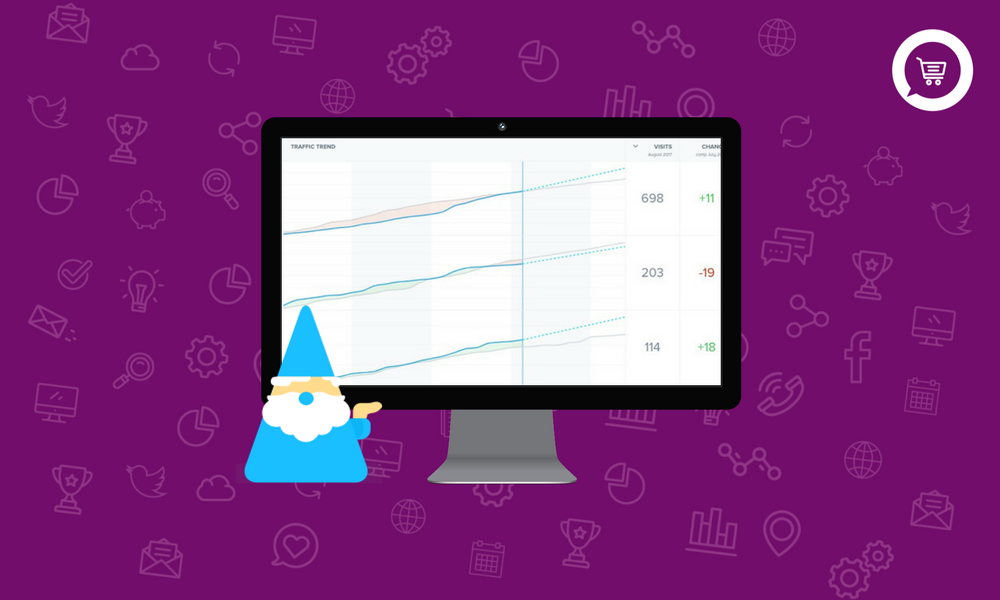
How are your Channels Performing?
Like most sites, online stores have visits pouring in from a variety of sources. Wouldn’t it be nice to understand which of these referral channels were performing the best without probing through a bunch of numbers and creating your own charts?

Divvit allows you to see how all of your channels are doing, both in paid and organic. You get a comparaison of your traffic flow against the previous time period (the line in gray) versus how your traffic is actually performing, in green or red depending on if it’s higher or lower than the previous time period. Your prospected traffic is the dotted blue line at the end of each slope, predicting what your traffic might be like based on what you’ve already done during this time period.
You also get the real data from the side with the actual number of visits that channel has brought in. In addition, you can see the exact number of differences and the percentage of change versus the previous month. Right before your eyes you can see the exact performance of your site by channel with how it performs based on past performance.
What to do with this information:
If you know which of your channels are performing up to standards, you can allocate more budget to those channels, and more energy. However, if you’re not bringing in more traffic from, say, Facebook, you can do a few tests to see how you can boost those visits. For example, if Facebook isn’t bringing much to the table organically, you can test out a paid campaign (which is arguably cheaper than Google paid) and see how that works with conversion.
Knowing your Sales Funnel Intimately
Using an analytics tool that’s created for e-commerce has advantages: like being able to visualize your sales funnel as an actual funnel.

You can visualize exactly what your sales funnel looks like, and where the hangups are. For example if you see that there are many that are getting to the checkout and not many are converting, you know that this is what you need to optimize.
What’s more is that you can actually see that through a larger wedge in the checkout section to a very narrow conversion funnel. On the sides of the chart, you can also see data on the average bounce rate, the percentage of those who explored your site and didn’t decide to purchase, where checkout failed, and then the overall conversion rate.
What’s particularly cool about this is that you can actually choose to add a funnel (on the bottom right of the screenshot) and compare several funnels by channel and see just how useful they are to you.

So here, I’ve compared
- Social organic traffic: traffic coming in naturally through social media
- Referral traffic: visits coming in from links on other websites (blogs, etc)
- Organic traffic: traffic coming in naturally from search engines
Organic traffic is your baseline- it’s the natural traffic that your site generates through SEO and search query. However, compare it to referral traffic- which seems to be doing better than organic. So when other sites talk about your store and refer customers to you, you tend to do better in conversion.
The overall bounce rate is higher- meaning that 26% of your customers that come from the other sites aren’t there to buy, but there’s a good chance that if another site is speaking highly of your store, that customers who turn up might purchase in the long run, perhaps on the second or third visit.
What’s cool about this snapshot is that you can compare your baseline traffic (organic) with how your social and referral campaigns are doing. As you can see when you look closer at the social traffic, the bounce rate is far lower than organic or referral traffic. What does this mean?
If people are coming to your site via a social media post, it’s likely that they’ve already seen the product they’re interested in, or perhaps a new line caught their eye. The fact is, with the power of visually appealing social posts, users that come to your online store via this channel, whether paid or organically, have a certain familiarity with your products. Though the conversion rate isn’t quite as nice as via referral traffic, it’s still higher than your overall organic.
What to do with this information:
Knowing how each of your channels is performing is integral to how much budget and time you should spend on each. For the example above, we can see that the funnel for referral traffic is much wider and works better towards conversion. In this case, it might be better to invest more time into getting other sites to talk about your store.
However, we can also see excellent conversion potential with your social channels. So in this case, you would want to perhaps put a bit of budget on paid campaigns that are well-targeted and put more time into creating amazing social media posts.
On the organic side, compared with the overall traffic that you get on average, the conversion is still quite low. While this is to be expected, it might be an indication that you need to work on your SEO and paid search campaigns to only target those who are looking for the types of products you sell. Targeting these keywords and PPC campaigns is your best bet for raising that conversion rate, as well as driving only the most pertinent visitors to your site.
Order Explorer: Knowing the Direct Path between Discovery and Purchase
Wouldn’t it be nice if you could see the entire journey of your customer before they purchased?
Well, with Divvit you can.

Probably the best feature of this app is the order explorer feature. With this, you can check out exactly how many touch points a customer needed between first discovering your site and purchasing from you.
Think about it: when was the last time you stumbled upon an online store and directly purchased on the spot? Rare- right? It usually takes a few reminders: whether that be via well-placed Facebook ads, a Twitter or Pinterest post, or maybe coming up in a search- or maybe it takes all of those points.
With this feature, you can examine each order and see exactly how many times that customer visited your site, from where they came, and how much they spent. We can see the 4th customer down, who visited the site five times before spending over 3 times the average order. While it took more touch points for that particular customer, we can presume it’s because they were looking to make a larger order and needed more time to decide.
You can filter this to look at any time period you’d like, as well as filter out only larger or smaller orders. If you want to focus on raising your average order value, for example, you can filter out anything above a certain amount and focus on how much these customers are spending, what they’re ordering, and what kinds of products to propose them with their next order to raise their spending.
Naturally, you can export each of these views into a customized report for later study.
What to do with this information:
When you have a detailed look into how much your customers are spending, from where they’re coming, and how many touch points they need before purchase, you can better optimize your UX to respond to these criteria. For the example above, you can see that several of your customers came via Google but not many via Bing. While you wouldn’t necessarily put Bing on the backburner completely, you could put more of your time and energy into Google campaigns.
If you see that many of your customers are seeing X amount of pages before purchasing, you could implement a pop-up with a coupon for their first purchase to convert more quickly. Alternatively, if you see that many of your customers from a certain channel aren’t converting, you could pinpoint and offer those customers free shipping or some other goodie to keep them on your site longer and clench the sale.
On another note, if you’re using affiliates to drive customers to your site, like many online sellers are, being able to see exactly who comes to your site from which channel is extremely useful to you. You can see if your affiliate programs are really paying off and you can see exactly who you would need to pay out once the order is complete.
Data and analytics are powerful tools once you know how to use them. Tools like Divvit can help you put the power of your data back into your hands and understand in layman’s terms how to best manage your store. With this information, you can optimize and customize your store so that it’s as efficient as possible.
This is definitely a tool that can give you insights into your online store without the headache- and it’s worth a look.There is a free version of Divvit that allows you to access the majority of the data that you’d need to at least get an idea of how your e-commerce is performing. However, the features that really set this tool apart from the others, like the order explorer, live trackers, and report exports are only available in the paid version.
That being said, if you want to test out those features for yourself, Divvit is currently offering a 14-day free trial, and with their quick and easy set-up, you can start getting valuable insights that will help grow your store today!
What are your thoughts on using data and analytics? Tell us below or tweet us!